How Recommender systems works (Python code — example film Recommender)
Nowadays we hear very often the words “Recommender systems” and mainly it’s because they are quite often used by companies for different purposes, such as to increase sales (items’ suggestion while purchasing → Amazon: user that have bought this as also bought this) or in suggestions to customers to give them a better customer experience (film suggestion → Netflix) or also in advertising to target the right people based on preferences similarities.
The recommender systems are basically systems that can recommend things to people based on what everybody else did.
Here there is an example of film suggestion taken from an online course. I want to thank Frank Kane for this very useful course on Data Science and Machine Learning with Python. Here there is the course’s link in case you would like to go deeper with Data Science.
We’ll make an example taking the database provided in the course, because it’s not too big and this will help with speed of calculus. In any case online there are a lot of resources, such as MovieLens Database with 20M ratings, 465k tag, 27k movies and 138k users.
How does Recommender System works?
Recommender Systems, as we said earlier, are an systems to recommend items to users. We have 2 kind of Recommender systems:
- User-based: the model find similarities between users
- Item-based: the model find similarities between items
There are PRO and CONS for both of them, here an other article if you want to read further about this topic.
These systems are based on similarities, so the calculation of the correlation between data, so between users for the first case and items in the second case.
The correlation is a numerical values between -1 and 1 that indicates how much two variables are related to each other. Correlation = 0 means no correlation, while >0 is positive correlation and <0 is negative correlation.
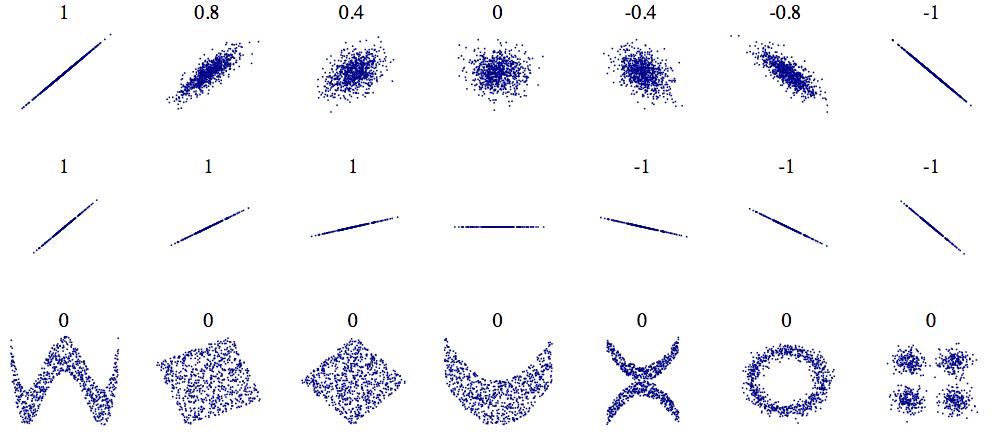
Here a graphical visualisation (font wikipedia)of the respective correlation coefficient of 2 variables (x,y):
We can see that correlation =1 or -1 do not refer to the slope of the data but just to how the data are related between each other. There are different methods to calculate the correlation coefficient, one of them in Pearson method:
So the correlation is the Covariance between two variables, X and Y , and the multiplication of their Variance.
There are also other methods to do it as Scatter diagram, or Spearman’s Rank Correlation coefficient, or method of Least squares.
In our model we’ll use the item based because we are considering that a user based system could be influenced by the change of film taste in the time by people and also because having less films than items, will fasten our calculations.
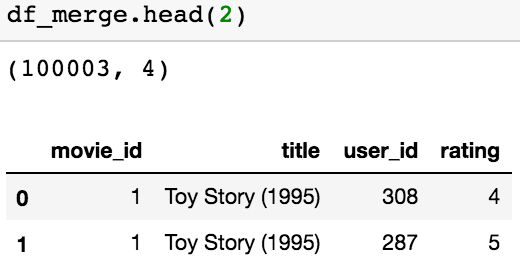
Let’s start importing our dataset. Our starting point will be a merged dataset (let’s see just the first 2 rows with the “.head()”):
As we see the dataset has 100k rows that correspond to the ratings we have. The informations in the table are the:
- movie_id
- title
- user_id
- rating
Before calculate all correlations and prepare our data for it, let’s make quick considerations: with this model we do not have a mathematical way to calculate the accuracy of the model, but we can try to use the common sense and intuition. For example one thing that we can do is to consider if we have in out list films that we know already can be correlated. For example we can think of Star Wars or Star Trek Series. The idea is that if someone has watched an episode of the serie and the rating was also high, I would expect that he also like the other film of the serie.
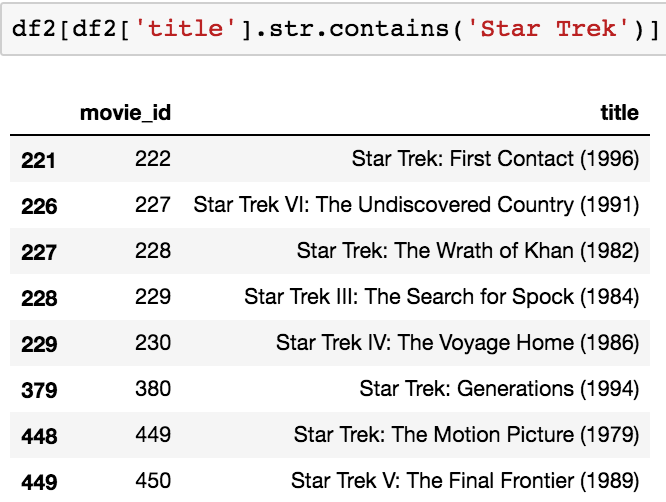
So let’s check how many film of Star Trek we have in our dataset. For this we can use a function of pandas that let us to find string of text in the columns:
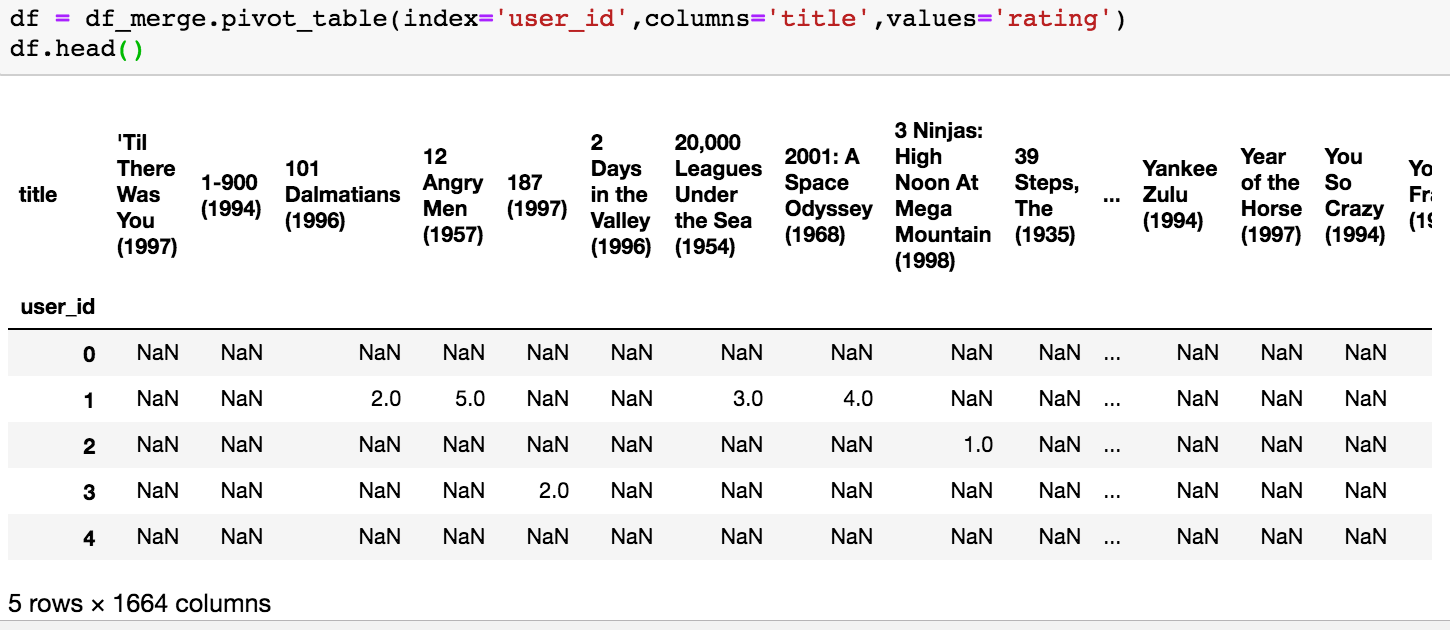
Before starting with the correlation calculation, we need to have all ratings of a film in columns, the rows will represent the users and the data in the table will be the ratings. For this we can use the function pivot_table of pandas as below:
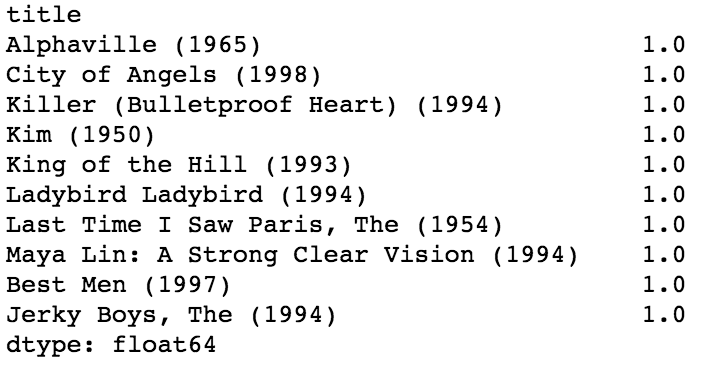
Once we have this new table, we can calculate the correlation of the Star Trek column with all others and for this we can use the corrwith function


We can see clearly that something went wrong with this result, considering that we expected to find other Start Trek films. So probably what’s wrong is that we are considering all the films, even those that have just 1 rating and this do not give to the model consistency.
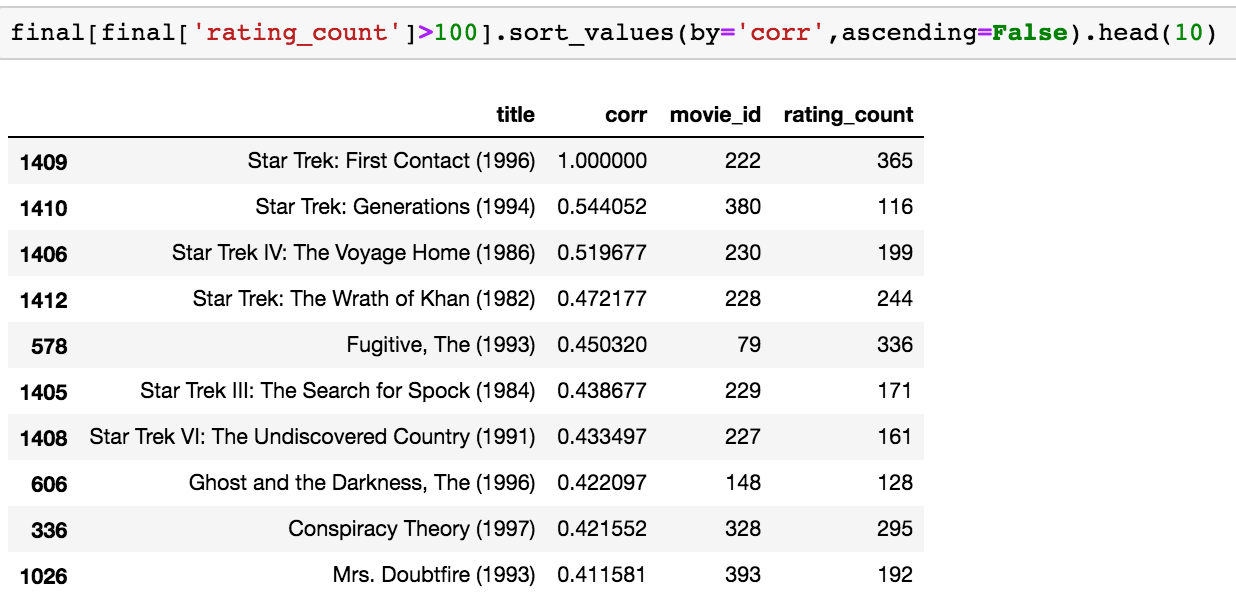
Let’s try to filter the films with count of ratings>100 and let’s see what happen:
Now the result looks more realistic as wee see that there are other episodes of Star Trek serie in the result. So, we could also try to do some other tests with other film, but let’s consider that the result is good and let’s implement it now on all the dataset.
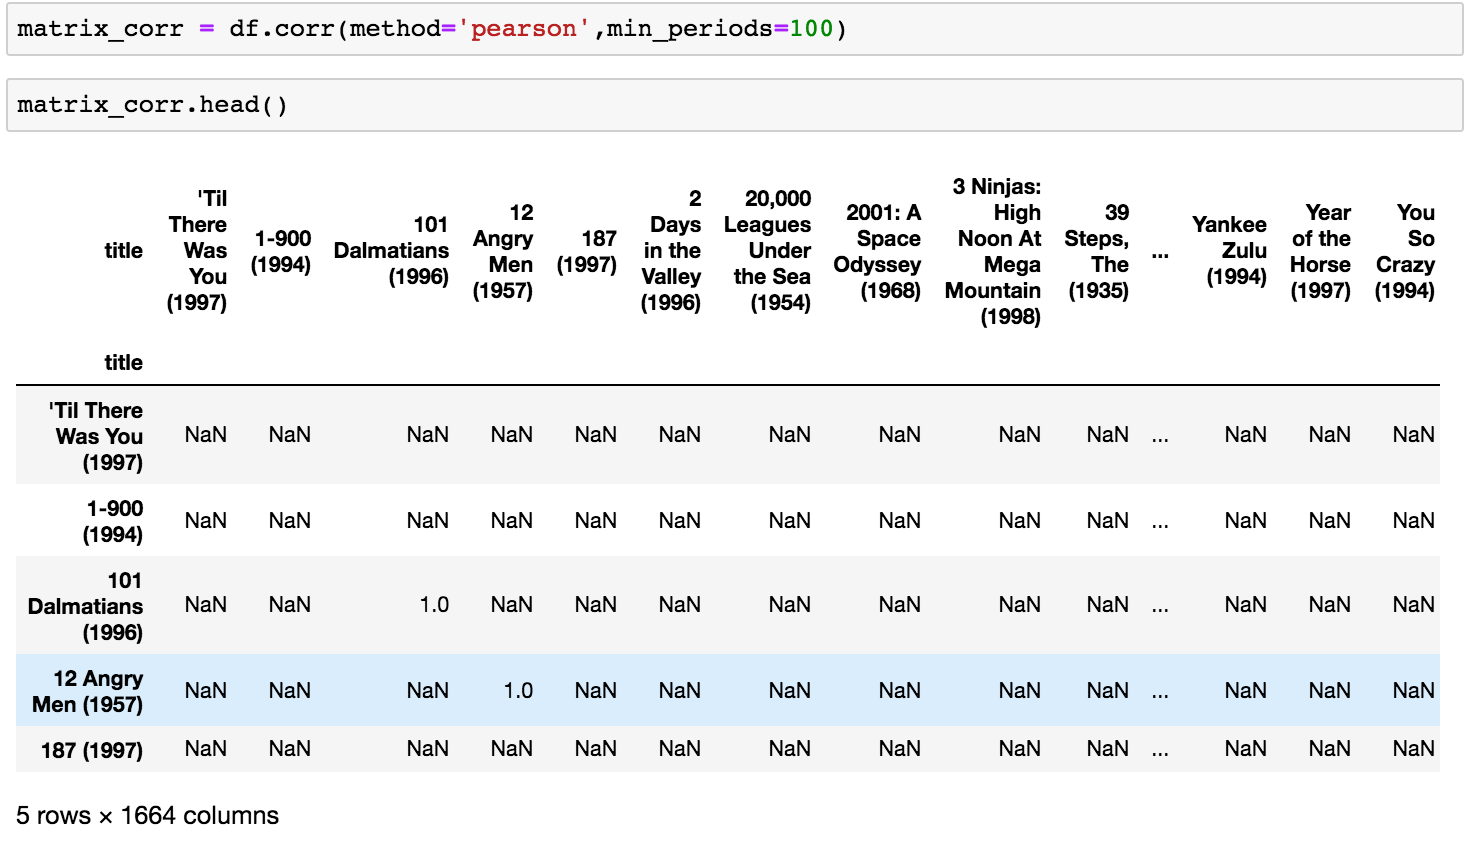
Pandas makes it very easy for us, considering that we’ll use also a shorter function than before :) corr, instead to corrwith.
We’ll use the filter min_periods=100, this will do the work for us and we’ll not need to filter anymore; we can also specify which correlation function to use, and in this case we’ll use the Pearson formula.
This is the result:
So we have calculated the Correlation Matrix for all film, having as result a 1664x1664 matrix where both columns and rows are films and the diagonal of the matrix will be all 1 because every film is related with itself or Nan in case the film has been filtered out with 100 ratings.
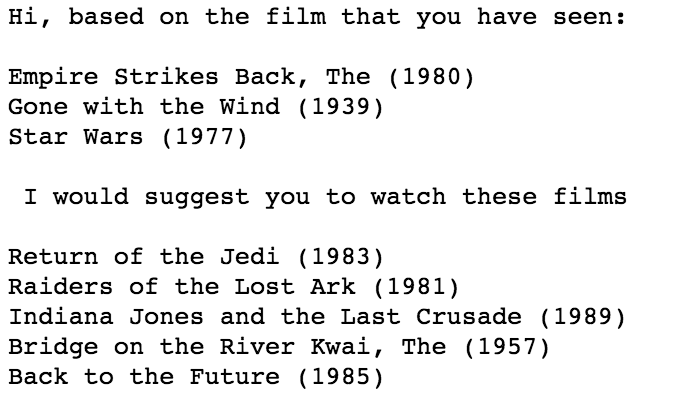
Now that we have the Correlation Matrix comes the fun part, where we have to suggest to the user which are the films (output of our system) that best match with his previous preferences (that will be the input of our system).
So starting from the Correlation Matrix, we’ll consider all the columns corresponding to the film the user already watched, for each column, we’ll drop the Nan Values. Once we have the values, we can consider to multiply each value for the rating considering it as weight (we’ll increase correlation, that will not be anymore between -1 and 1, for the film that user liked with higher rating) and after we’ll append all the values of all the columns considered in a Series “user_corr”.
In the Series we need to do few other operations:
- groupby title summing the correlation value (this is why we could have the same film appearing more than once)
- drop all the film that the user has already watched
Once we have the final Series, we can ordered the values in descending order (ascending=False) and suggest the first 5 films or how many films we want.
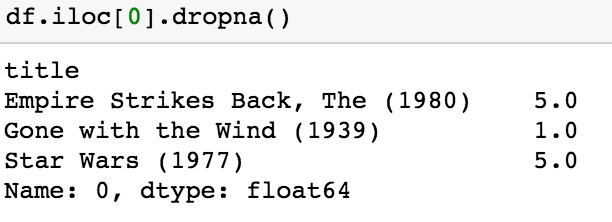
Let’s see the steps with coding applying what we said for the user 0. This is the list of the film the user watched:
We create now the list of all film with all correlations multiplied by ratings (integers from 1 to 5).
We make the groupby in order to not have duplicate films and we also sum their rating:

We create a list of the film we have seen (checking before if they are in the series of all correlations) and than we drop them:
Once we have the final list ordered we can print the result to our user hoping he will like the suggestions :)
We have seen an example on how we can suggest a list of film for existing user or also for any other user just giving some input to the system as title of the film watched and our rating. The more data we will have and the better consistency the system will have.
We can also play with the system trying to changing the parameters as the filter to 100 rating or also the method for calculate the correlation or you can also to consider the impact of ratings in a different way in the system.
As you can see there isn’t a just a system but it’s possible to try different options giving different solutions, finding also a way for the improvements.
Consider also that we can apply this method to all other possible data, for example also to suggest to the customer which item he would like to buy.
At this point I’m happy if you are arrived till the end and follow me in case you have found it interesting or useful in someway!
Enjoy data science!
Enjoy data science!



Comments
Post a Comment